|
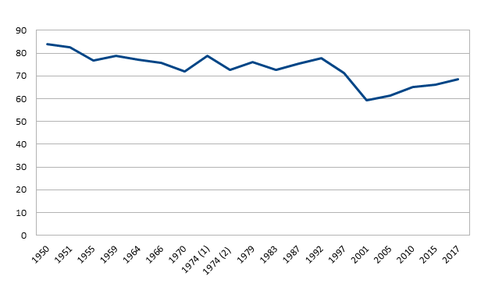
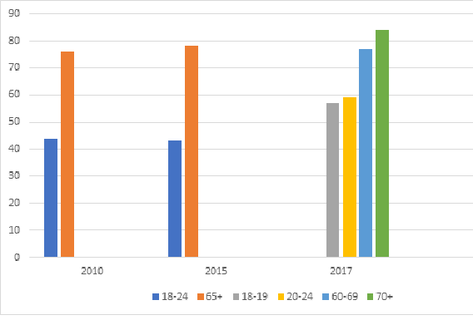
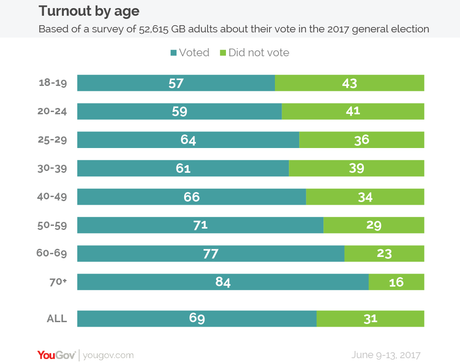
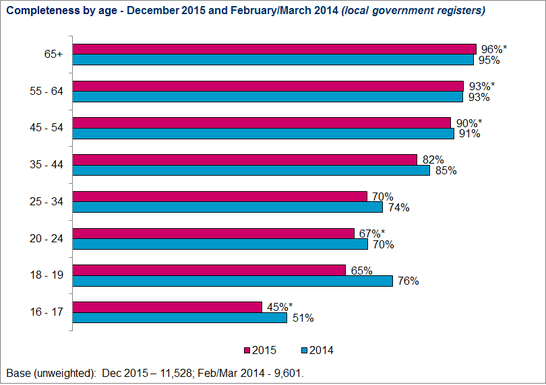
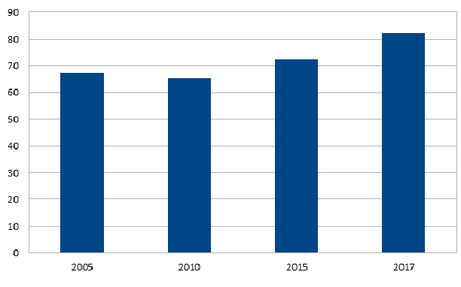
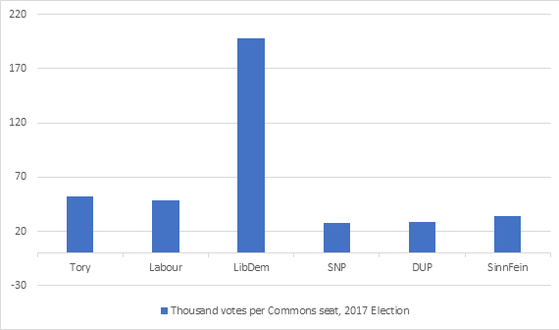
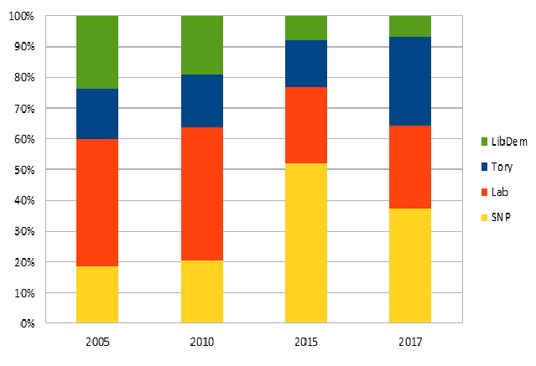
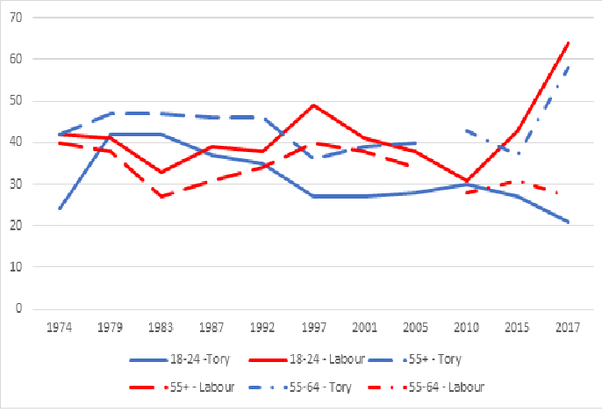
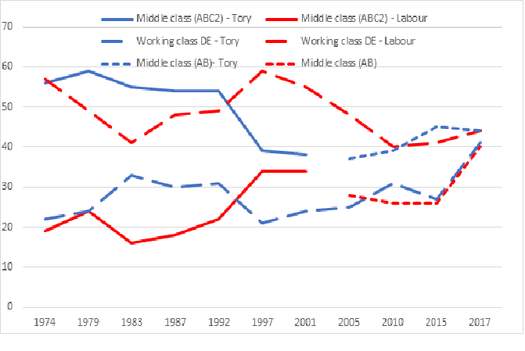
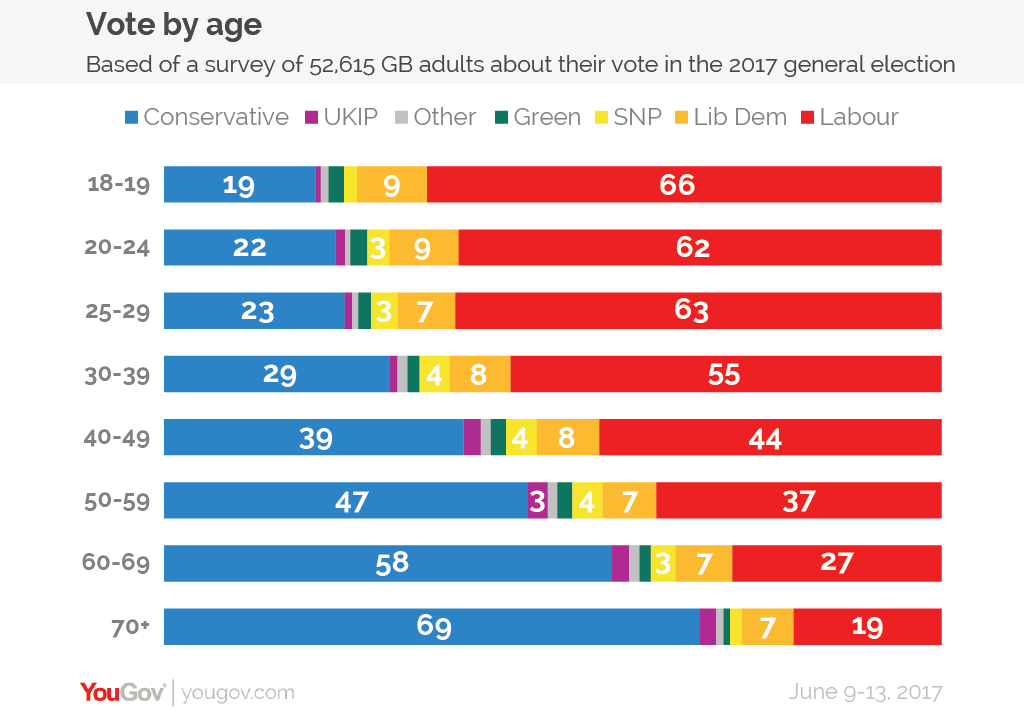
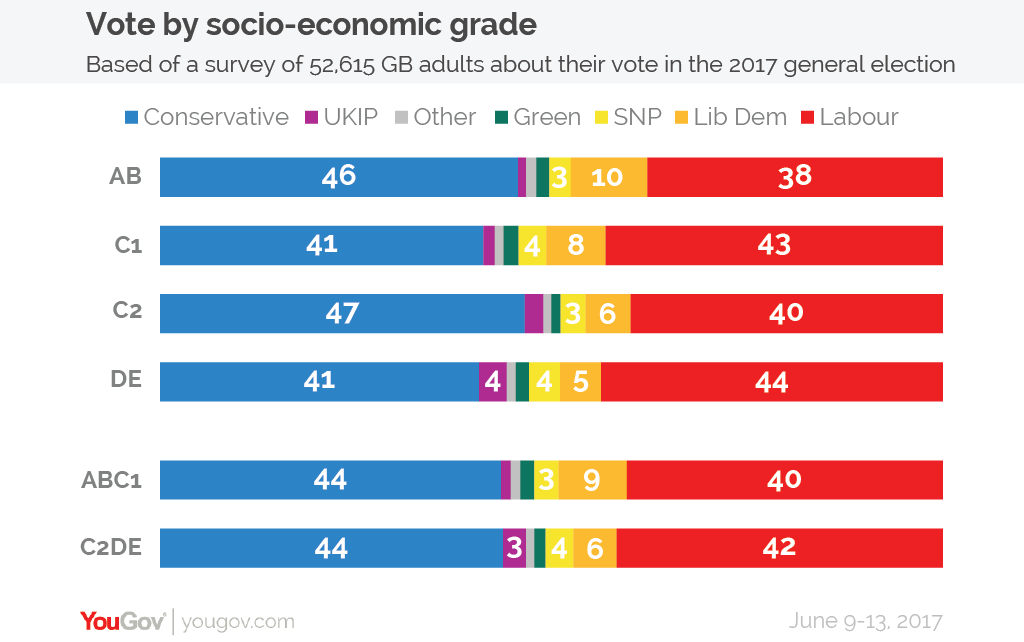
We now have the first good data on the pattern of voting in the recent Election, that is, based on a representative sample interviews conducted after the Election (from YouGov). (Earlier figures had been estimates based on pre-Election voting intentions, or on correlations between voting patterns an demographics in each constituency.) The data suggests big changes in the behaviour of the electorate which the Tories should be very worried about, but there is unpleasant news for Labour too. Here are the main themes as they strike me. The British are becoming more engaged with politics – chart 1 Turn out has been rising since 2005 – though is still way below what is what in the last century. (By the by, isn't it curious that the historic collapse of turnout occurred under Tony Blair, the great communicator?) Chart 1: long term trend in % turnout Source: http://www.ukpolitical.info/index.htm The young have woken up – some of them – charts 2 and 3 It has been a dependable truth in politics that the young don't register and don't vote, while the old do both. That was certainly true in the in the 2015 Election. (There is some evidence that turnout was higher for the Referendum. (Note 1)) That may be changing. Nearly twice as many 18-24 year olds registered in the run up to this Election, compared to the same period before the 2015 Election. For the first time in a General Election, so far as I can establish, a majority of young people who are registered actually bothered to vote. (But turnout was slightly higher for the old, too.) Chart 2: trend in % turnout of young and old groups But even now, the young are still nowhere near as engaged as the old. Chart 3: turnout by age, 2017 Election (from YouGov report) Forget that line about the old stealing the future from the young; the young gave it away. I can't do the modelling, but it looks likely that if the young had matched the oldest on registration and turnout, Remain might well have won and Corbyn might well be in No.10. But still, 6 million Britons exlude themselves from our democracy - chart 4 The latest estimates for electoral registration date back to 2015, when research by the Electoral Commission suggested that some 15% of those eligible to register do not do so. That overall figure has changed little since previous estimates, but within the total, there have been significant falls in registration by the young, by private renters v home owners, and by those who move frequently. Registration rates, like turnout rates, increase with age. Chart 4: estimates of changes registration rates by age (from Electoral Commission) These falls were associated with the move from whole household registration to individual registration in 2014. Was the move to individual registration a cunning plan by evil Tories to crush the young and exclude them from power, as the Left now seem to believe? Hardly: Labour introduced it in Northern Ireland, and the Electoral Commission had pressed hard for it to be adopted across the UK. And it was the right thing to do. Allowing the head of the household to register everyone living there harked back to an earlier, patriarchal age, and was open to fraud. 18 year olds are adults - and should be treated as such, not as children. At the same time, registration has become infinitely easier, and quicker: it takes about 3 minutes online (when campaigning on the Referendum, we were able to register people right there and then on the street). There are frequent public campaigns to tell people how to register. One might think that if people cant be bothered, they deserve to be excluded from political participation. And some might have their own perhaps nefarious reasons for not wanting to be on the register. One the other hand, it isn't a healthy democracy where 1 in 7 people exclude themselves, bearing in mind that of the remaining 6, 2 are registered but then don't vote. Specifically, it is damaging to our society, and leads to distortion in policy making, that the young are so under-represented. There is a case for making up-to-date registration mandatory (rather than voting – which doesn't seem to work well in other countries), for example, if you want to claim benefit or a bank account or a driving licence or bank card or insurance, you have to be registered at that address. Two party politics is back - charts 5 and 6 The proportion of votes cast for the two big parties is back up again, reflecting the collapse of UKIP and the fall in SNP, LibDem and Green votes. Chart 5: % of votes cast for Labour + Tories One consequence is that the 'disproportionality' of the vote - the extent to which different votes were over and under represented in terms of seats - measured by something called the Gallagher Index - was lower than it has been for a long time (Note 2). This is because in a First Past the Post system, the more votes there are for smaller parties, the more 'disproportional' the results. It's still pretty disproportional, of course: Chart 6: seats required per Commons seat, by party, 2017 Makes one think, when the DUP hold the balance of power! Multi party politics is back in Scotland - chart 7 The threat of a perpetual SNP monopoly of power in Scotland has receded. Chart 7: trend in distribution of votes between parties in Scotland (But for Labour and LibDems, little revival in terms of vote share: rather, the story is of a break-through by the Tories. Perhaps because the Scottish Tories have demonstrated clearly that they arent content to be simply the Edinburgh office of a London based conglomerate, perhaps because they are so clearly opposed to another independence vote, which seems remarkably unpopular in Scotland now, just as a 2nd EU referendum is unpopular here.) Age has replaced class as the dividing line in UK politics - charts 8-11 This is the most interesting part. Until this election, the main dividing line between Labour and Tories was class. Chart 8: trend in % votes cast for Tory and Labour parties, by age, 1974 on (data from Ipsos Mori) Note: Ipsos Mori changed their definition of age groups in 2010, hence the break in series, but the trend is clear. And is even more pronounced if one uses the over 64s in later years. Chart 9: trend in % votes cast for Tory and Labour parties, by class, 1974 on (data from Ipsos Mori) Note: again, the definition of class changed in 2005, so again a break in series. There should be a special circle in Hell reserved for statisticians who repeatedly break a series without doing the data on both bases for at least one year. The middle class had a brief fling with Labour under Blair – as we know – but in 2010 and 2015 seemed to return to their usual strong bias towards the Tories. While the working class was loyal to Labour. Meanwhile on age, there had (incredible though it may seem) never been a consistent correlation between youth and voting Labour. The young moved to Labour under Blair but in 2010 were again evenly split Tory/Labour. The old by contrast had indeed always been more Tory but often by only a small margin – and they too swung to Blair (was there any group immune to his charm?) But now look at the full 2017 results (switching to YouGov here since their data appear to be based on post Election interviews, not exit polls or pre Election intention to vote polling). Charts 10 and 11: voting by age, and by class, 2017 (YouGov) Class seems no longer matter. What matters now is age: the young are overwhelmingly Labour, the old overwhelmingly Tory. The age gradient is steady: YouGov calculate that for every 10 years extra age, the Tory lead increased by 9 points. The crossover – where Tory voters start to outweigh Labour – is now 47.
47! That figure should terrify Tory strategists . The young are lost to them. (Of course it is possible that as the current young age, they will turn rightwards; but then new first time voters will also one assumes be overwhelmingly Labour.) An additional factor is that Labour was so imaginative this time with its use of social media – the Tories barely compete. The Mail and Express preach to the converted. True, one election does not confirm a trend. It may all look different next time (just as the Blair boom for Labour among the middle classes and young faded by 2010). And it's true that the British public just now are nothing if not changeable. But the figures are so strikingly different to anything that has gone before that one senses the change may be a continuing one. It is also consistent with brutal economic and political realities. As the Intergenerational Foundation has charted, the past decade has seen a huge switch in the balance of present and future wealth from young to old: student debt, unaffordable housing, pensions, you name it (note 3). It has also seen a historic decision of unprecdented importance, Brexit, won by the old against the wishes of the young, nostalgia and reaction trumping hope and opportunity. The young should be seething. The influence of the Referendum Might this sea change may be in part a side effect of the Referendum campaign? Because it was not fought on party grounds, and both main parties were split on the issue, it may have served to 'un-moor' voters from traditional loyalties. The Referendum also pitted the backward looking against the future minded, age v youth. But what does it mean? One can go on analysing the vote in terms of this and that social group, area, Leave v Remain and so on. But to me, the result had a more general meaning. It feels like the nation is struggling to say something, perhaps something like this: “You politicians, you've have done your best to divide us, and you've succeded brilliantly. We're are now more divided than ever, and you'll find that makes us difficult to govern, just as we face the perils of Brexit and terrorism, and the challenges of low growth, an aging population, and heavy debt. How will you bring us back together, so that we can face the future positively?" To do that, we need leaders of exceptional vision, generosity and humility. But all I see are 3rd and 4th raters, mouthing out-dated and failed ideologies, looking to short term personal and party advantage, placemen, mountebanks, liars and of course, the great buffoon, serial liar, cynic, cheat and racist lout who hopes to be our next PM. Only one MP, perhaps, springs to mind, who might have developed into the sort of politician we now need: Jo Cox. NOTES 1) see: http://www.ecrep.org/wp-content/uploads/2015/03/Did-young-people-bother-to-vote-in-the-EU-referendum.docx 2) The index involves taking the square root of half the sum of the squares of the difference between percent of vote. Since you ask. 3) http://www.if.org.uk/the-issue/
0 Comments
Your comment will be posted after it is approved.
Leave a Reply. |
I was formerly Finance Director of the Prison Service and then Director of the National Offender Management Service responsible for competition. I also worked in the NHS and an IT company. I later worked for two outsourcing companies.
Archives
July 2024
Categories
All
Click below to receive regular updates
|
 RSS Feed